
Recently, Allie Parks, our Senior Solutions Consultant at Citylitics, in an article for Water Online, looking at Ontario’s future infrastructure.
Imagine a future where an online platform uses artificial intelligence to rapidly scan the vast reaches of the internet for any references to infrastructure projects past, present and future. You are automatically delivered a report that filters down the millions of web results encountered into the relevant matches that fit your needs and search parameters. The future is now with the Market Intelligence Platform developed by Citylitics, Inc. of Toronto. Infrastructure for the software is broken down into seven categories: transportation, wastewater, water, solid waste, airports and aviation, power and electricity and stormwater. This product is used by Citylitics customers to determine trends and business opportunities. But for this article, the author used the program to explore the most prevalent themes across Ontario infrastructure planning based on data from 16,000 upcoming projects. Urban migration, extreme weather events, and deteriorating infrastructure mean that Ontario municipalities have no shortage of options for where to put their money.
Citylitics has amassed the largest dataset on planned municipal projects in Ontario, with over 37,000 upcoming infrastructure projects collected from 162 Ontario municipalities. These insights have been aggregated into a Capital Projects Dashboard, which allows for the exploration of themes and trends across different municipal infrastructure sectors.
The parameters for the data presented in this article were based on several key trends for Ontario’s capital priorities, namely:
- Capacity constraints from population changes
- Replacement of deteriorating infrastructure
- Sustainability and climate resiliency initiatives
- A spotlight on water and wastewater spending
Capacity Constraints
Ontario’s population has increased steadily for decades, with over a 12% population increase over the last 10 years. But the growth is not geographically uniform. Demographic changes within the province, largely driven by COVID-19, have residents in large metropolitan areas dispersing to smaller communities. The effects of COVID-19 have had a lasting impact on Ontario communities outside of Toronto. From mid-2020 to mid-2021, over 64,000 people have moved out of Toronto to other parts of Ontario. These municipalities are now playing infrastructure catch-up to accommodate a surge of previous city dwellers.
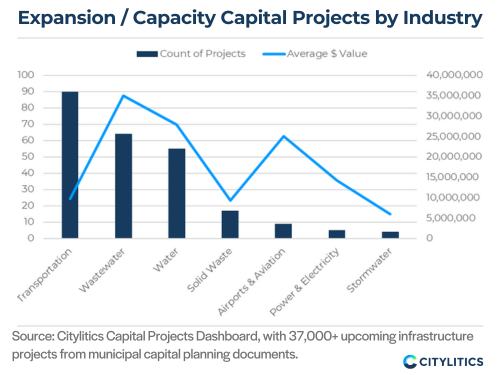
Figure 1 breaks down the CIP project that mentioned “expansion” as a goal of the project by sub-sector to see overall volume of projects, as well as the average dollar spend by industry. Transportation projects, primarily road widening and expansion projects dominate CIPs, but tend to be much less costly for cities than capacity improvements in water & wastewater.
Replacement of Deteriorating Infrastructure
Many cities published 2020 budgets only to find them completely derailed once lockdowns began in March. Perhaps nowhere was this more apparent than in the public transit sector. In Toronto, ridership fell by 86%, costing the TTC $94 Million monthly in lost revenue in the wake of COVID. While ridership is slowly rebounding for Toronto, agencies have had to lean on government relief programs to sustain adequate operations. “Poor conditions”, “repair and replacement”, “useful life”, and “remaining life” were common in the most recent CIPs in Ontario across transit as well as other sectors.
Entities will continue to grapple with how long they can scrape by with crumbling infrastructure. Prolonged deferments also lead to unexpected
maintenance and replacement costs, incentivizing municipalities to act. By focusing on CIP projects mentioning “rehabilitation” specifically, we can take a quick look at where entities are spending their maintenance dollars. Figure 2 summarizes the results of a search and data analysis for “rehabilitation”.
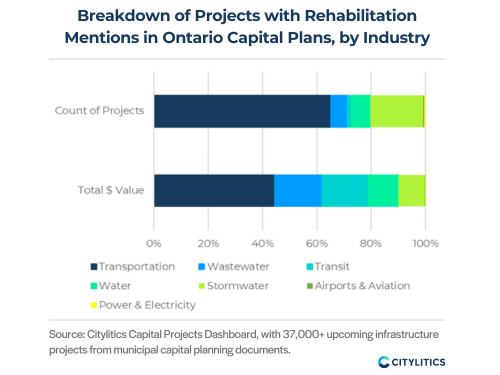
Over 700 projects specifically mention “rehab” or “rehabilitation” in the project description or title. Of these:
- 65% are related to roads, bridges, and other transportation infrastructure
- 19% of rehab projects were focused on stormwater infrastructure, the second most common rehabilitation focus
- Drinking water and wastewater treatment and collection projects come in third and fourth, representing 7% and 8% of overall rehab project volume respectively.
- The final 2% of rehab projects by volume focus on transit, airports & power projects, which are typically larger but with limited volume.
When it comes to total dollar spend among these 700+ rehabilitation projects, transportation, wastewater and transit rehabilitation projects are the costliest, making up nearly 80% of the funds allocated to rehab. While there is a high volume of stormwater rehabilitation projects overall, the average dollar value of these projects are much smaller than other infrastructure projects.
- Transportation Infrastructure: $1.5 Billion
- Wastewater: $593.8 Million
- Public Transit: $583.2 Million
- Drinking Water: $378.5 Million
Sustainability and Climate Resiliency Initiatives
Disaster mitigation is a huge focus for municipalities, with Infrastructure Canada committing to $1.4 Billion across the country for disaster mitigation and adaptation over the next 12 years, half of which is focused on small projects. 159 planned projects specifically mention floods or flooding alone in Ontario CIPs, and as the costliest natural disaster in Ontario, municipalities are highly incentivized to act. Flooding is not the sole environmental concern however, with 129 projects mentioning “resiliency”, “adaptation”, or “mitigation” specifically in the project description.
Electric vehicle adaptations in Ontario are also picking up steam, with 30 upcoming projects centered around either municipal fleet conversions, charging stations or electric vehicle studies. The average cost for electric vehicle projects came in at $2.3 Million, with the most substantial expenditures typically centered around new charging stations. Many other climate studies are likely to explore these initiatives more specifically in years to come. Multiple project descriptions mentioned funding options from the federal Zero Emissions Vehicle Infrastructure Program.
Ontario has also been a leader for water reuse and biogas/waste-to-energy production in Canada, with some of the best rates in North America for renewable electricity from biogas and a section dedicated to biogas regulations on the provincial website. Fifteen projects mention biogas or reuse in Ontario, with the average cost for projects coming in at $1.4 Million.
Water and Wastewater Trends
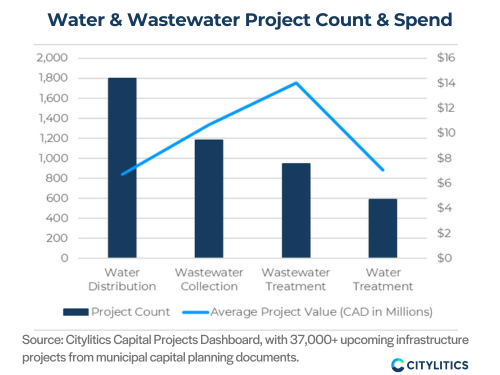
With a total of $918.3M in water and wastewater projects aggregated from Ontario’s capital plans, infrastructure needs are as critical as the services themselves. Figure 3 highlights the results of a search and data analysis for four aspects of water infrastructure in Ontario.
By further categorizing spending across drinking water and wastewater, we can see that water distribution projects, including new and rehabilitated service lines as well as infrastructure such as metering, contribute the highest number of projects. However, when it comes to dollars spent, wastewater collection and treatment come with the largest price tag.
There are several wastewater treatment plant projects in Ontario with costs over $170M. Of those that specify their plans in greater detail, expansion, biosolids upgrades and sludge disposal projects make up the most costly projects.
Summary
This article has presented early-stage intelligence on a wide range of project infrastructure types, from infrastructure upgrades to future looking transportation and smart city initiatives. With significant investment anticipated for the infrastructure industry in North America over the next few years, Citylitics helps clients better direct their efforts by consolidating precise insights from a fragmented public sector landscape, whether that’s in Ontario or any other jurisdiction.
With the right data-driven insights, business development professionals have the ability to
strengthen relationships and secure infrastructure project opportunities n a proactive way, long
before the business opportunity arises.
References
Statistics Canada (2021)
Population Estimates, Ottawa, ON
https://www150.statcan.gc.ca/t1/tbl1/en/tv.action?pid=1710000901
Toronto Transit Commission
(2020, May13). TTC Board Meeting Minutes, Toronto, ON
https://www.ttc.ca/public-meetings/board/2020/Board-Meetings-May-13?tab=1