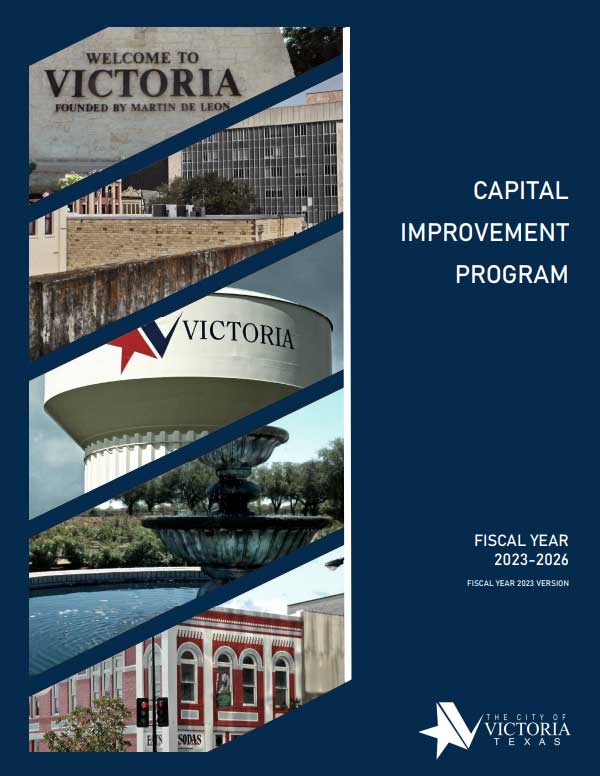
The City of Victoria faces several infrastructure challenges, including an aging transportation system, water and wastewater systems, and buildings. The city’s transportation infrastructure is struggling to keep up with the increasing demand, resulting in traffic congestion and limited access to public transit. The water and wastewater systems are in need of upgrades to ensure reliable and efficient service to residents. Additionally, many of the city’s buildings are aging and require significant repairs and renovations to meet current safety and accessibility standards.
City of Victoria, British Columbia
Population (Year): 92141 (2017)

Sample Highlights from the Capital Improvement Plan
Project ID
Project Title
Project Start Year
Project Description
Project Spend Total
Page Ref
Project Satus
615616
Vine Street Reconstruction Project ‐ Mockingbird to Red River
2024
“Consists of reconstructing Vine Street (20,473 Sq. Yd.) from Mockingbird to Red River. Current average street rating is 53. Project will provide a post
PCI score of 96.”
1731000
42
Not Started
615625
Airline Road Mill and Overlay (Ben Jordan to Sam Houston)
2024
“Consists of mill and overlay of Airline Road between Ben Jordan to Sam Houston (approximately 15,825 sq yds) with a current average PCI score of
45. Project will provide a post PCI score of 93.”
712125
43
Not Started
615689
NE Water St. Water Line Replacement
2024
“Project scope includes replacing 2,200 LF of 10″” and 1300 LF of 6″” cast‐iron water line with 12″” and 8″” PVC water lines in NE Water Street from Juan
Linn Street to East Street and Cameron Street. Railroad permits will be required to replace the water main across the Union Pacific tracks near East
Street.”
865000
53
Not Started
615747
Mallette Dr. Mill and Overlay (Briggs to Ball Airport)
2025
“Consists of mill and overlay of Mallette Dr. between Briggs and Ball Airport (approximately 8,475 sq yds) with a current average PCI score of 45.
Project will provide a post PCI score of 90.”
496980
66
Not Started
615782
Airline Rd. Sanitary Sewer Line Abandonment Project
2025
“Project scope includes replumbing the private sanitary sewer service for 38 homes from rear easement sanitary sewer lines to the existing sewer
mains in the Airline Road, Manor Street, and Locust Avenue Right‐Of‐Ways. This will allow the existing lines in the rear easements which cannot
be easily maintained to be abandoned.”
528000
73
Not Started
Explore all options available to you!
Citylitics offers access to over 30,000 unique locations across North America through our Capital Projects Dashboard (CPD).
Capital Projects Dashboard (CPD) provides a comprehensive market view of all planned infrastructure spend in one single view with powerful filters such as: population, project value, fiscal year, project status, project description, geography, and more. The dashboard will help identify opportunity hot spots, create data-driven forecasts you can be confident in with bottom-up data for the next 5 years of planned infrastructure spend, and uncover true market needs.
How to Read a Capital Improvement Plan (CIP) for Business Development?
When a city, municipality or state issues a Capital Improvement Plan (CIP), it can be overwhelming and daunting, but there are a few key things you need to investigate. Let’s start with the definition of CIP – A Capital Improvement Plan (CIP) contains all the individual capital projects, equipment purchases, and major studies for a local government; in conjunction with construction and completion schedules, and in consort with financing plans. The plan provides a working blueprint for sustaining and improving the community’s infrastructures. It coordinates strategic planning, financial capacity, and physical development. A CIP stands at the epicenter of a government’s Planning, Public Works, and Finance departments. When a CIP is issued, it typically includes the following information:
- A listing of the capital projects or equipment to be purchased
- The projects ranked in order of preference
- The plan for financing the projects
- A timetable for the construction or completion of the project
- Justification for the project
- Explanation of expenses for the project
Now, for business development, while the capital plan is interesting, the capital program is for capital expenditures that extends five to ten years beyond the capital budget. Knowing the difference is important so you can influence upcoming program versus just responding to an RFP. If reading the CIP makes your head explode, or you want to save time, Request a Demo of Citylitics CIP dashboard with over 20,000 CIPs from USA and Canada. Citylitics has 20,000 plus available CIPs, how can we help you? What states, cities or counties are you looking to improvement your business development, we can assist you in influencing an upcoming RFP versus simply responding to an RFP. Citylitics Capital Projects Dataset is a comprehensive resource for businesses and organizations looking to track and analyze planned infrastructure spend in their area. The dataset offers a range of features and benefits, including:
- Comprehensive Market View: The dataset provides a single view of all planned infrastructure spend, with powerful filters such as population, project value, fiscal year, project status, project description, geography, and more. This allows businesses to gain a comprehensive understanding of the market and identify new opportunities.
- Identify Opportunity Hot Spots: The dataset offers map views and filters that allow users to identify opportunity hot spots where they need to allocate resources. This helps businesses to understand where they should focus their efforts to achieve the best results.
- Create Data-Driven Forecasts: The dataset provides bottom-up data for the next 5 years of planned infrastructure spend, allowing businesses to create data-driven forecasts they can be confident in.
- Uncover True Market Needs: The dataset allows businesses to develop long-term business plans, R&D, and growth initiatives based on true, bottom-up market needs instead of opinions and anecdotes. This helps businesses to make more informed decisions and achieve better results.
With Citylitics Capital Projects Dataset, businesses can gain a deeper understanding of planned infrastructure spend in their area, which can help them to identify new opportunities and make more informed decisions.
