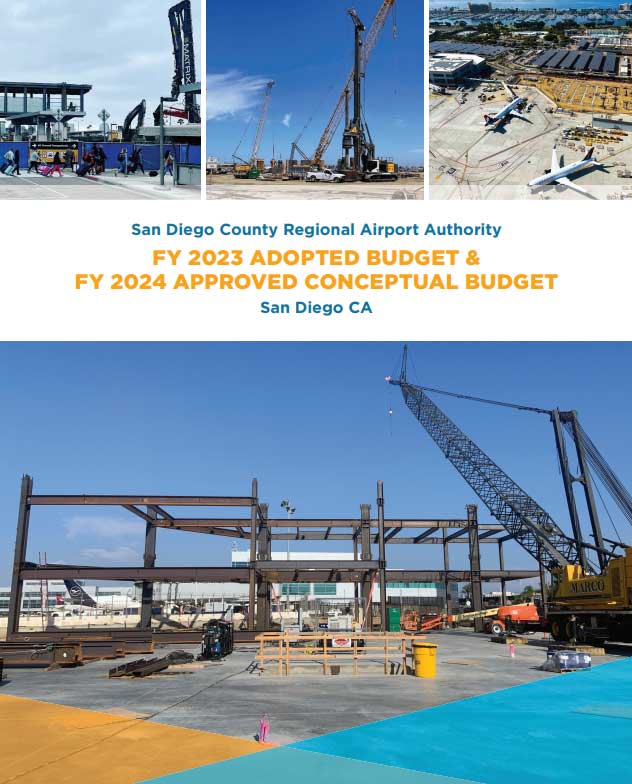
The San Diego County Regional Airport Authority faces several key infrastructure challenges, including managing and upgrading its aging airport facilities and infrastructure, increasing capacity to meet growing demand for air travel, improving access to public transit and other transportation options, ensuring compliance with federal safety and security regulations, and managing the impacts of climate change on airport operations. Additionally, the authority must balance the need for infrastructure improvements with the cost of these projects, while also providing high-quality air travel services and supporting economic growth and development in the San Diego region.
San Diego County Regional Airport Authority, California
Population (Year): ()

Sample Highlights from the Capital Improvement Plan
Project ID
Project Title
Project Start Year
Project Description
Project Spend Total
Page Ref
Project Satus
540575
EVSE for GSE at New T1 Phase 1b (11 Gates)
2026
“Project will furnish and install electric vehicle charging stations at 11
gates in the New T1. This phase will install 22 dualport units
providing 44 ports and additional units at the corral. This will help to
fulfill New T1 EIR Mitigation Measure and the Authority’s Carbon
Neutrality Plan & Clean Transportation Plan”
3300000
252
Not Started
540578
Upgrade Aircraft Noise Monitoring System
2028
“Upgrade system with new hardware/software on 23 existing sites and
build a new permanent noise monitoring site offsite near east end of
airfield. This will provide for improved noise monitoring capabilities for
the Authority.”
500000
253
Not Started
540579
Replace 2 ARFF Vehicles
2027
“Project will replace two SAN Aircraft Rescue & Fire Fighting Vehicles
with vehicles equipped with 3,000 gallons water, 420 gallons of AFFF
and 500 lbs. of dry chemical.”
3000000
253
Not Started
540583
Access Control System at Perimeter Fence
2023
“Project will install Access Control System Infrastructure along the
north side perimeter fence from the ILS area adjacent to cross taxiway
B10 to the ARFF station, including fiber, rack room, CCTV and cameras.”
3000000
253
Ongoing
540585
“Admiral Boland Way Murals Public Art”
2025
“Project provides an on-going opportunity for artistic design and
enhancement to be integrated along the north end of the Admiral
Boland Way”
125000
254
Not Started
Explore all options available to you!
Citylitics offers access to over 30,000 unique locations across North America through our Capital Projects Dashboard (CPD).
Capital Projects Dashboard (CPD) provides a comprehensive market view of all planned infrastructure spend in one single view with powerful filters such as: population, project value, fiscal year, project status, project description, geography, and more. The dashboard will help identify opportunity hot spots, create data-driven forecasts you can be confident in with bottom-up data for the next 5 years of planned infrastructure spend, and uncover true market needs.
How to Read a Capital Improvement Plan (CIP) for Business Development?
When a city, municipality or state issues a Capital Improvement Plan (CIP), it can be overwhelming and daunting, but there are a few key things you need to investigate. Let’s start with the definition of CIP – A Capital Improvement Plan (CIP) contains all the individual capital projects, equipment purchases, and major studies for a local government; in conjunction with construction and completion schedules, and in consort with financing plans. The plan provides a working blueprint for sustaining and improving the community’s infrastructures. It coordinates strategic planning, financial capacity, and physical development. A CIP stands at the epicenter of a government’s Planning, Public Works, and Finance departments. When a CIP is issued, it typically includes the following information:
- A listing of the capital projects or equipment to be purchased
- The projects ranked in order of preference
- The plan for financing the projects
- A timetable for the construction or completion of the project
- Justification for the project
- Explanation of expenses for the project
Now, for business development, while the capital plan is interesting, the capital program is for capital expenditures that extends five to ten years beyond the capital budget. Knowing the difference is important so you can influence upcoming program versus just responding to an RFP. If reading the CIP makes your head explode, or you want to save time, Request a Demo of Citylitics CIP dashboard with over 20,000 CIPs from USA and Canada. Citylitics has 20,000 plus available CIPs, how can we help you? What states, cities or counties are you looking to improvement your business development, we can assist you in influencing an upcoming RFP versus simply responding to an RFP. Citylitics Capital Projects Dataset is a comprehensive resource for businesses and organizations looking to track and analyze planned infrastructure spend in their area. The dataset offers a range of features and benefits, including:
- Comprehensive Market View: The dataset provides a single view of all planned infrastructure spend, with powerful filters such as population, project value, fiscal year, project status, project description, geography, and more. This allows businesses to gain a comprehensive understanding of the market and identify new opportunities.
- Identify Opportunity Hot Spots: The dataset offers map views and filters that allow users to identify opportunity hot spots where they need to allocate resources. This helps businesses to understand where they should focus their efforts to achieve the best results.
- Create Data-Driven Forecasts: The dataset provides bottom-up data for the next 5 years of planned infrastructure spend, allowing businesses to create data-driven forecasts they can be confident in.
- Uncover True Market Needs: The dataset allows businesses to develop long-term business plans, R&D, and growth initiatives based on true, bottom-up market needs instead of opinions and anecdotes. This helps businesses to make more informed decisions and achieve better results.
With Citylitics Capital Projects Dataset, businesses can gain a deeper understanding of planned infrastructure spend in their area, which can help them to identify new opportunities and make more informed decisions.
